This post is based on a talk by Eskil Andréen, CTO of Wrapp. Some parts are directly taken from his presentation, while other are my personal view on the topic. If you like any of what you read thank Eskil if you don’t blame me :)

What is Wrapp

Wrapp was founded around 4 years ago and the first version of the product was an application to send digital gift cards to your Facebook friends. A bit more than a year ago the company pivoted and the new product is a loyalty platform that integrates with your credit/debit card and automatically gives discounts based on your purchase behavior.

When it was decided to pivot and close the old service we took the decision of getting rid of all our backend infrastructure and start from scratch with a new architecture based on microservices. The requirements for the new architecture were scalability, availability and ease to introduce changes.

We are currently 14 people in the tech team and all our infrastructure runs on Amazon Web Services (AWS).

Why microservices at Wrapp

At the time when the pivot was started our backend consisted of a few monolithic applications written in Python that after three years of fast paced development were messy and full of technical debt.

To make things worse there were a lot of shared dependencies between the applications and this required a complex infrastructure. We also had a tone of tests and that made introducing changes to the existing code harder.

We hoped that microservices would help to prevent those issues. With microservices each component is small and simple, which means that it is more feasible to keep the code well organized and less tests are required.

We also wanted to make work more rewarding by allowing developers to design their components as they wish, with the tools they want (language, libraries, frameworks…) and because smaller units of work are more satisfying to complete. Finally, encouraging collective ownership by involving everyone in the design and implementation of complete parts of the system.

How does Wrapp look now

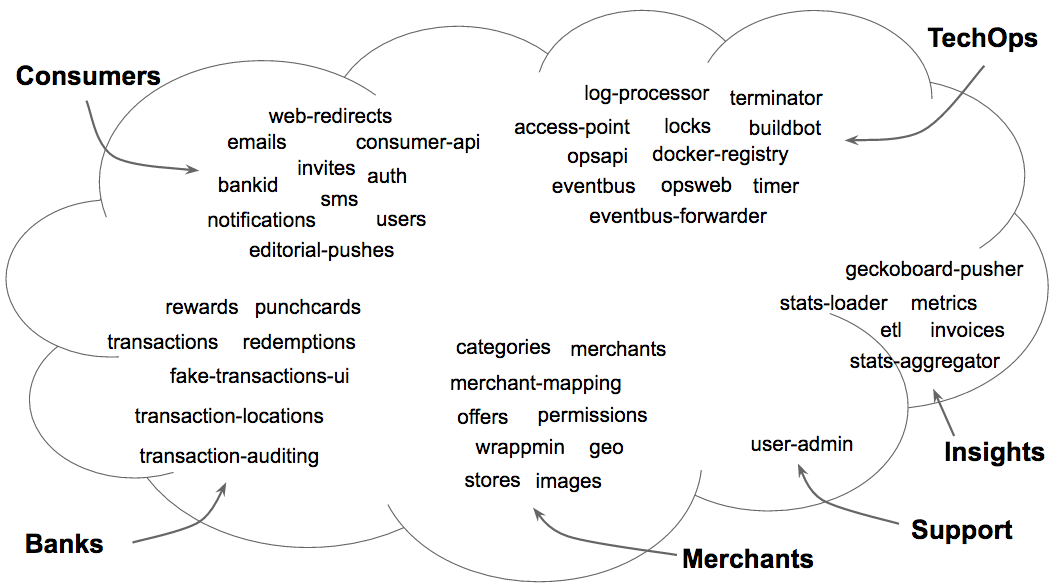
One year after starting the complete rewrite of our backend we have launched a new product and doubled the size of the tech team. Our backend is formed by around 50 services, each one run as Docker container, mainly written in Python and Go; Everything that is important for our product is a service. In this word cloud you can see most of the services that conform Wrapp’s backend:

Microservice cloud

Tenancy or where to run each service

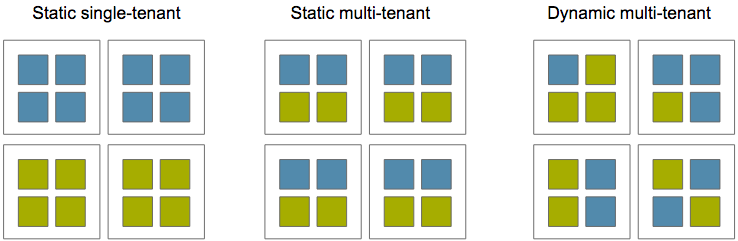
We started with the simplest approach, single-tenancy: Each server runs a single type of service. The main benefit of this approach is its simplicity, the problem though is that it is wasteful as many services are idling most of the time or are very small and don’t use all the resources of the machine where they run.

To solve that we evolved to static multi-tenancy: Each server runs a predefined set of services. This partially solves the issues of single-tenancy, but forces you to manually decide how to group services.

Finally we are using dynamic multi-tenancy: Services are dynamically assigned to hosts without any per-host static configuration. We use Amazon ECS to manage the placement of our services.

Where to run each service?

Service discovery

After a few iterations we have a solution that transparently handles addition and deletion of services and is based on DNS, Consul, Registrator and HAProxy.

Our solution requires us to assign a different private IP address from a predefined IP range to every service. For convenience we map the service name to their private IP address using DNS. Then Registrator, Consul Agent and HAProxy run in each server of the cluster:

  • Registrator inspects Docker containers as they come online/offline and informs the local Consul Agent of the services that they run.
  • Consul Agent periodically registers the services that are running in the machine to the Consul Catalog and refreshes the configuration of the local HAProxy to include all the services listed in the Catalog via consul-template.
  • The range of private IP addresses that are mapped to the different services are configured as aliases for the local loopback device. Haproxy binds to each of these IP addresses and load balances the requests among the available instances of the respective service.

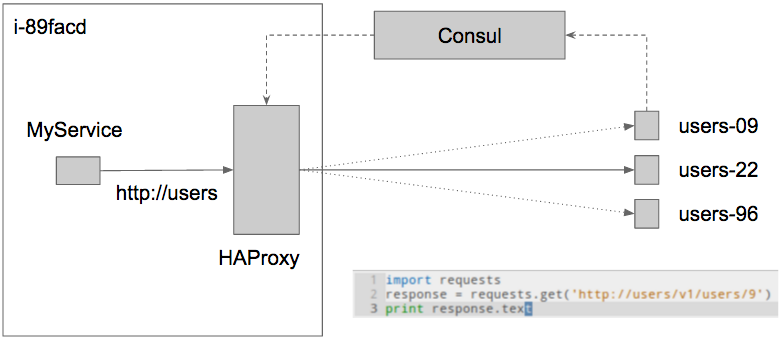
To better understand this mechanism, lets use an example; Suppose we are adding a new service into our cluster, the users service, this is what happens:

  • We assign the IP address 192.186.10.1 to the users service and add the DNS name users.internal.ourdomain mapping to that IP.
  • The new service is deployed, and it starts running in a subset of our servers.
  • Registrator running in those servers detects a new Docker container running the users service and informs the Consul Agent. Consul Agent will register it to the Consul Catalog.
  • The Consul Agent running in each server eventually gets the new list of services from the Consul Catalog and updates the local HAProxy configuration adding a new backend to serve requests to the IP address assigned to the users service 192.186.10.1.
  • Finally, when when a request is issued to users.internal.ourdomain the DNS name is resolved to 192.186.10.1 and the local HAProxy receives the request and forwards it to one of the instances of the users service.
Performing a request

By default the services are only accessible from within our network. For services that need to be accessible from the internet we have a service connected to a public load balancer that takes care of receiving requests and forward them to the specified internal service.

Inter-service Communication

Each service exposes a REST API and inter-service communication is done over HTTP with JSON payloads. Communication can be synchronous HTTP requests or it can be done using the eventbus.

The eventbus is in itself a microservice that offers publish/subscribe functionality. It is built on top of Amazon SQS and SNS. It guarantees at least once delivery and automatically retries failed requests. We use this way of communication for all the tasks that don’t require an immediate response.

Given the amount of services and requests involved in performing any complex task, it is not strange that one of them fails. For this reason it is a good practice to have retrials on requests. This means that requests must be idempotent, issuing the same request multiple times should always produce the same result. From our experience, having retrials and idempotent requests really helps in dealing with the complexity that aries from working in a distributed system.

Monitoring

It is a complex system with lots of moving parts, so there are many things to monitor and we use a few different strategies:

  • Monitor logs for warnings, errors and deviations.
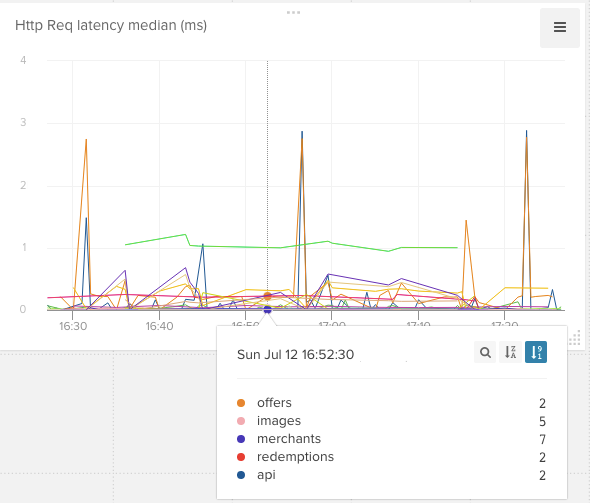
  • Monitor Network traffic: number of requests, latency, percentage or errors.
  • Define and monitor KPIs for each service important service.

You can check out this blog post Monitoring microservices with haproxy and riemann to know more about our monitoring tools.

Conclusion

After one year working with microservices they have brought a lot of good things to our organization and have been overall a great choice, confirming most of our initial expectations. We have a relatively big and complex system, composed by many small and simple services. This means that it is simple to understand, extend and even replace individual components of our backend, giving us great flexibility. Furthermore we feel that microservices have a great positive impact in developer satisfaction.

We also face a few issues from using microservices. First of all it was a big upfront time investment to develop the required infrastructure to support microservices: deployment, service discovery, monitoring…

Secondly, distributed systems are hard and with microservices we face all the issues that come with them regarding consistency, atomicity and concurrency. It is also hard to cleanly split complex functionalities between multiple services and model the interactions between them while keeping the involved services decoupled.

Finally there is an important overhead in implementing and maintaining HTTP interfaces and clients for each service and we face higher latency due to multiple http hops. Any common task performed by the clients of our API requires tens of HTTP requests between different services.

A special mention is also reserved for testing; Our approach is having a strict contract for the interface of each component and focus our testing efforts in internal service tests that make sure that the contract is satisfied. But it is hard to be sure that interactions between services will work as expected when they are put together and we haven’t found a good way of performing automatic integration tests.

For all these reasons is probably not a good idea to use microservices for small projects or those that have well defined and non-changing requirements, as then the benefits of microservices are less obvious.

Need microservices
Shoud you use microservies? (Source: http://www.stavros.io/posts/microservices-cargo-cult)

Introduction

Twisted is an asynchronous programming framework for Python. Twisted is huge and can be a bit confusing at first, but I will try to explain the basics to be able to get started using it.

First of all though, it is important to be familiar with the computing model behind Twisted: Asynchronous programming. If you are already familiar with this topic feel free to skip the next section.

Asynchronous Programming

Let’s start by reviewing the other two traditional computing models to be able to compare with them: single thread model and multithread model.

The traditional single thread (synchronous) model is very simple: only one task is performed at a time, and a new task can’t start until the previous one has finished.

The multithread model is a bit more complex. In it, each task is executed by a separate operating system thread, and the operating system can replace the running task by another one at any time. On a system with multiple cores, different threads can run truly concurrently, or may be interleaved on a single core. It is important to notice though, that in Python, because of the Global Interpreter Lock (GIL), multithread applications never run truly concurrently.

In the asynchronous model, tasks are interleaved with one another in a single thread. The main characteristic of an application following this model is that when the task being run is going to block, the application will continue executing another task, minimizing the time that the whole application is blocked. In this model, the running task is replaced by another when either it finishes or it is going to block.

An application benefits from using this model if it consists of a set of independent tasks with a fair amount of blocking. The most common cause for tasks to block is waiting for I/O to complete, like reading or writing from the network or the file system. That’s why the canonical applications for this model are a web server or a web client.

The Reactor and Deferreds

Twisted has two main components: the Reactor and Deferreds

The Reactor reacts to events and schedules tasks, that’s why it is known as Reactor or Event Loop. The job of the Reactor is to manage the pool of tasks that are waiting to be executed. When the running task gives control to the Reactor by starting an asynchronous operation, the Reactor takes care of putting the task in a waiting state, setting a mechanism to call the result handler associated with the task once the result is available, and continue executing another task.

The other important component of Twisted are Deferreds. Deferreds encapsulate asynchronous tasks, similar to the idea of Promise or Future in other frameworks. Asynchronous functions in Twisted return a Deferred, and the Deferred is used to control the execution of the task and access the result once it is available.

To interact with a Deferred we can attach a series of functions to be called (fired in Twisted terminology) when the result of the asynchronous task is available. These series of functions are known as callbacks or callback chain. We can also attach a list of functions to be called if there is an error in the asynchronous task, known as errbacks or errback chain. The first callback is called when the result is available, or the first errback if an error occurs.

Enough with the theory, lets get started with a few simple examples.

Example: Getting a URL

Let’s start with a simple example, getting the contents at a URL and printing the returned HTTP code. For this we will use Treq, a library inspired by Python Requests written on top of Twisted.

from twisted.internet.task import react
import treq

def get_url(url):

    def handle_response(resp):
        print "Got response code %d from %s" % (resp.code, url)

    def handle_failure(failure):
        print "Something failed: %s" % failure.getErrorMessage()

    print "Getting URL %s" % url
    d = treq.get(url)
    d.addCallback(handle_response)
    d.addErrback(handle_failure)
    return d

def main(reactor, *args):
    url = 'http://google.com'
    d = get_url(url)
    return d

react(main)

Let’s analyze this code by parts:

  • react is a utility function provided by Twisted that starts the reactor, executes the provided function, in this case main, and stops the reactor once all tasks have finished.
  • The main function takes care of calling get_url with a specific url.
  • get_url calls treq.get, that gets the contents at the requested URL. As it is an asynchronous function, treq.get returns a Deferred.
  • We add a callback to the returned Deferred that prints the response code, and an errback that prints the error if something goes wrong.

Example: Getting multiple URLs

The first example was quite similar to a normal single thread program, let’s see a bit more of Twisted by slightly modifying the first example in order to get multiple URLs concurrently. We only need to modify the main function for this:

from twisted.internet.task import defer

def main(reactor, *args):
    urls = ['http://github.com', 'http://www.google.com', 'http://www.facebook.com']
    ds = map(get_url, urls)
    d = defer.gatherResults(ds)
    return d

Here we call the get_url function for multiple URLs, getting a Deferred for each call. Then we use the Twisted function gatherResults to create a new Deferred that gets fired when all the provided Deferreds have fired.

Inline Callbacks

Finally I would like to tell you about inline callbacks, a Twisted utility that allows writing Deferred-using functions that look like regular sequential functions.

from twisted.internet.defer import inlineCallbacks

@inlineCallbacks
def get_url(url):
    print "Getting URL %s" % url

    try:
        resp = yield treq.get(url)
        print "Got response code %d from %s" % (resp.code, url)    
    except Exception as e:
        print "Something failed: %s" % str(e)

This version of get_url has the same behavior as the previous one, but with the inlineCallbacks decorator we can use yield to wait for the result of a Deferred instead of using callbacks and errbacks, making the code look similar to a sequential program.

If everything goes well, the result of the Deferred will be the value returned with the yield, if there is an error, an exception will be raised.

Conclusion

I hope this is enough to get you started with Twisted. If you want to know more I suggest looking here:

  • Twisted documentation, I specially recommend the part about Deferreds: https://twistedmatrix.com/documents/current/
  • A more in depth explanation of Asynchronous Programming and Twisted: http://krondo.com/wp-content/uploads/2009/08/twisted-intro.html

The Goal

We are developing a complete new infrastructure following a Microservices Architecture at Wrapp, the company where I work. Currently we have tens of different services, each of them exposing a REST API, and all the communication between services is done over HTTP.

Each service runs in a Docker container, and we run between 5 and 10 containers in each server. At any given moment we have tens of servers running hundreds of instances of our services, and it is not easy to know what is going on in the system.

We wanted a way to be able to get metrics for each of our services, like the number of received HTTP requests, the average latency or the number of 500s.

Networking between the different services is done through HAProxy, that runs locally on each server. With this set up, the HAProxy access log has all the information that we need, so we decided to build a system to aggregate the information from the HAProxy logs from each server and extract the desired metrics.

The Solution

First we considered how we could produce different metrics with the stream of events, as it seemed the most difficult task. We wanted a system that was easy to setup and maintain, and also that was flexible enough so that we could easily add new metrics in the future.

We had used Riemann in the past, and we decided to stick with it. It is a bit hard to write Riemann configuration files, specially if you are not familiar with Clojure, but documentation is decent and in return you get a powerful an flexible system.

The next problem was how to forward the HAProxy log generated in each server to Riemann. We were already using Rsyslog to forward all the logs to a centralized log server, so we added a new rule to forward the HAProxy logs to the metrics service.

Riemann can’t directly parse the events sent from Rsyslog, so we decided to use Logstash to transform the events to a suitable format for Riemann.

Finally we needed a way to create nice graphs with the different metrics computed by Riemann, and after some investigation we opted for Librato, a good choice because there is a library to send Riemann events to Librato.

To sum up, the system has these five elements:

  • HAProxy: runs on each server and for every HTTP request logs the latency, return code, path and target service.
  • Rsyslog: runs on each server and forwards the HAProxy log to the metrics service.
  • Logstash: runs in the metrics service and gets the HAProxy logs from all the servers, parses each event and forwards it to Riemann.
  • Riemann: runs in the metrics service and computes different metrics with the events, and periodically sends the computed values for each metric to Librato.
  • Librato: gets the metrics from Riemann and shows them in a few different graphs in a dashboard.

It is worth noting that the metrics service that runs Logstash and Riemann is also a Docker container, and is deployed and run as any other service of our * infrastructure. The only special thing about it is that there is only a single instance of the metrics service.

The Result

Once finished we can compute and visualize all the metrics we desired, and it is easy to create new metrics by adding a bit of configuration code to Riemann.

In the image you can see the Librato graph for one of the metrics:

Graph with median request latency per service (fake data).

The Switch

I have used Sublime Text 2 for all my local coding during more than three years. I started using Sublime because I wanted a powerful, fast, multi platform code editor.

Around 6 months ago I read about Atom, an open source code editor developed by Github, and I decided to give it a try, but simply scrolling through a file had a noticeable lag, so I continued with Sublime.

A couple of months ago Sublime became slow in my computer due to a problem in the new version of a package, and I decided to give Atom a new opportunity; this time I stayed with it.

Why Atom?

Atom feels very familiar for a Sublime user, it has the same layout, and almost the same keyboard shortcuts, so switching to it is not extremely traumatic.

The main difference I found at first was the package manager. Unlike Sublime, Atom has an integrated and very functional package manager (apm) that can be used from the terminal or from Atom.

All the features that make Sublime great are also available in Atom, and some extra ones:

  • Fuzzy file finder cmd+P or cmd+T.
  • Command palette cmd+shift+P: Execute any command offered by Atom by typing its name.
  • Split editing: Edit multiple files side by side.
  • File (cmd+F) and project search cmd+shift+F.
  • Git integration.
  • Key binding resolver cmd+.: Best way to learn keyboard shortcuts.
  • And lots more: Project tree view, go to line/symbol, multiple cursors, markdown preview…

Setting up Atom

I use the theme One Dark, both for UI and syntax highlighting. Atom already comes with a bunch of pre installed packages, and I add the following ones:

For Python development:

For Go development:

  • Go plus: A real must, can be configured to run go format on save, automatically add imports with goimports, and presents the output of go vet and golint in the Atom console.

For React.js development:

  • React: React.js (JSX) language support, indentation, snippets, auto completion and reformatting.

The Good and the Bad

I have been using Atom as my main editor for a couple of months and I’m satisfied with it. It has almost all the good things of Sublime and a very active community with constant updates and improvements to both the editor and the packages.

But Atom is much less mature than Sublime and it has some rather basic issues, like Git integration not working properly when opening multiple Git repos in the same window, long start up time or not opening files bigger than 2MB; hopefully all this will be soon solved.

DynamoDB is a managed NoSQL database offered by Amazon as part of AWS. It is basically a key-value store with some nice additions, the most important, the ability to automatically maintain indexes over different attributes.

It is fast, scalable, and relatively cheap. The pricing model is based on throughput and storage. Amazon’s documentation is a bit complex, so here is a simplified description of DynamoDB that should be enough to get started.

Data Model

DynamoDB data model is based on schema-less tables that store rows and can be queried using indexes.

A table in DynamoDB needs a primary key, and the primary key always enforces a unique constraint. A primary key consists of one or two attributes:

  • A mandatory field, the hash key.
  • An optional field, the range key.

Apart from the primary key, a table can have additional indexes, called secondary indexes. There are two types of secondary indexes:

  • Local secondary index: an index that has the same hash key as the primary key of the table, but a different range key.
  • Global secondary index: an index with a hash and range key that can be different from those of the primary key of the table. Global secondary indexes can be seen as new tables that are automatically synced with the original table. When creating a global secondary index, it has to be specified whether to synch the entire table, or just the fields that are part of the primary key, or manually pick which fields to copy. In general, if your rows are smaller than 1KB, just sync all the data, as it is going to cost you almost the same (more on this in Pricing). Note that opposed to the primary key, global secondary indexes don’t impose a unique constraint. It is also important to take into account a big limitation of DynamoDB, indexes have to be defined when the table is create and it is not possible to add or delete an index to an existing table.

Query and Scan

There are two basic operations for reading data from DynamoDB, query and scan.

Query

A query operation gets items from a table using one of its indexes. A query operation must specify the index to use, the value of the hash key, and optionally the value of the range key with one of the available filtering operators (EQ, LE, LT, GE, GT, BEGINS_WITH, BETWEEN).

You read it right, the hash key always has to be provided, and it is evaluated with an equality condition. So if you need to perform complex queries, like getting all the rows created in the last hour, DynamoDB is not a good option.

You may wonder if you can walk around this limitation by defining an index with an extremely generic hash key, for example a constant, and use the filtering operators offered by the range key to perform more complex queries.

The problem is that is not a good idea to have a significant amount of rows mapped to the same hash key value. The hash key is used to distribute the entries of a table among different nodes, so if many entries are mapped to the same hash key, you lose the scalability and speed offered by DynamoDB.

So keep in mind that DynamoDB query capabilities are limited: the hash key is always filtered with an equality condition and even though the range key can be filtered with different operators, it has to be used together with the hash key.

Scan

A scan operation examines every item in the table. A single scan request can retrieve a maximum of 1 MB of data, to retrieve more data you need to do multiple requests with pagination.

Consistency

By default, read operations (query and scan) are eventually consistent. This means that the returned values may not reflect a recently completed write. According to the documentation, consistency across all copies of data is usually reached within a second.

In contrast, a strongly consistent read returns a result that reflects all writes that received a successful response prior to the read.

When performing a read operation, it is possible to specify that it has to be strongly consistent, though strongly consistent reads are not supported on global secondary indexes.

Pricing

The pricing model of DynamoDB is a bit peculiar, you are charged per table for three different concepts:

  • Storage
  • Read capacity
  • Write capacity

Storage cost is straightforward, being billed per GB, and it is is extremely cheap, currently 0.25$/GB per month, having 25 GB in the free tier.*

Capacity pricing is more complex. You pay for the provisioned (aka. maximum) throughput of the table, not the used capacity. The good think though is that you can change the capacity of the table as frequently as you want, and it only takes a few minutes for the new capacity to be available, with zero downtime.

Read capacity is the number of strongly consistent reads/second of items of size <= 4 KB. Eventually consistent reads consume only 0.5 read capacity units. If your rows are smaller than 4 KB, when performing a strongly consistent read, each fetched row will consume one read unit.

Write capacity is the number of writes/second of items of size <= 1 KB. When writing into the table each secondary index consumes an additional write unit. So if a table has one local secondary index and one global secondary index, adding or updating a row of size <= 1KB will consume 3 write units, 1 for the table and 2 for the indexes.

Capacity is billed hourly and the price is:

  • $0.0065 per hour for every 10 units of write capacity ($0.00065 write unit/hour).*
  • $0.0065 per hour for every 50 units of read capacity ($0.00013 read unit/hour).*

For example, if your table needs to support 10 writes/s and 100 strongly consistent reads/s, and the items stored are <= 1KB, it would cost:

10 write units x $0.00065 + 100 read units x $0.00013 = $0.0195/hour or $14.04/month.

*These prices are for US East region. To see the current prices for a specific AWS region check out this page.