The Goal
We are developing a complete new infrastructure following a Microservices Architecture at Wrapp, the company where I work. Currently we have tens of different services, each of them exposing a REST API, and all the communication between services is done over HTTP.
Each service runs in a Docker container, and we run between 5 and 10 containers in each server. At any given moment we have tens of servers running hundreds of instances of our services, and it is not easy to know what is going on in the system.
We wanted a way to be able to get metrics for each of our services, like the number of received HTTP requests, the average latency or the number of 500s.
Networking between the different services is done through HAProxy, that runs locally on each server. With this set up, the HAProxy access log has all the information that we need, so we decided to build a system to aggregate the information from the HAProxy logs from each server and extract the desired metrics.
The Solution
First we considered how we could produce different metrics with the stream of events, as it seemed the most difficult task. We wanted a system that was easy to setup and maintain, and also that was flexible enough so that we could easily add new metrics in the future.
We had used Riemann in the past, and we decided to stick with it. It is a bit hard to write Riemann configuration files, specially if you are not familiar with Clojure, but documentation is decent and in return you get a powerful an flexible system.
The next problem was how to forward the HAProxy log generated in each server to Riemann. We were already using Rsyslog to forward all the logs to a centralized log server, so we added a new rule to forward the HAProxy logs to the metrics service.
Riemann can’t directly parse the events sent from Rsyslog, so we decided to use Logstash to transform the events to a suitable format for Riemann.
Finally we needed a way to create nice graphs with the different metrics computed by Riemann, and after some investigation we opted for Librato, a good choice because there is a library to send Riemann events to Librato.
To sum up, the system has these five elements:
- HAProxy: runs on each server and for every HTTP request logs the latency, return code, path and target service.
- Rsyslog: runs on each server and forwards the HAProxy log to the metrics service.
- Logstash: runs in the metrics service and gets the HAProxy logs from all the servers, parses each event and forwards it to Riemann.
- Riemann: runs in the metrics service and computes different metrics with the events, and periodically sends the computed values for each metric to Librato.
- Librato: gets the metrics from Riemann and shows them in a few different graphs in a dashboard.
It is worth noting that the metrics service that runs Logstash and Riemann is also a Docker container, and is deployed and run as any other service of our * infrastructure. The only special thing about it is that there is only a single instance of the metrics service.
The Result
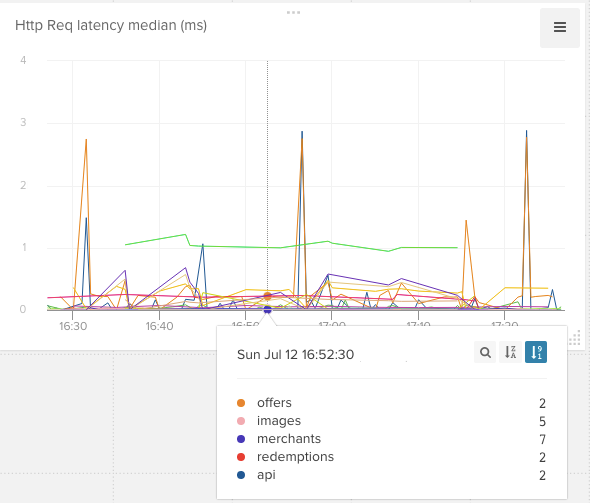
Once finished we can compute and visualize all the metrics we desired, and it is easy to create new metrics by adding a bit of configuration code to Riemann.
In the image you can see the Librato graph for one of the metrics: